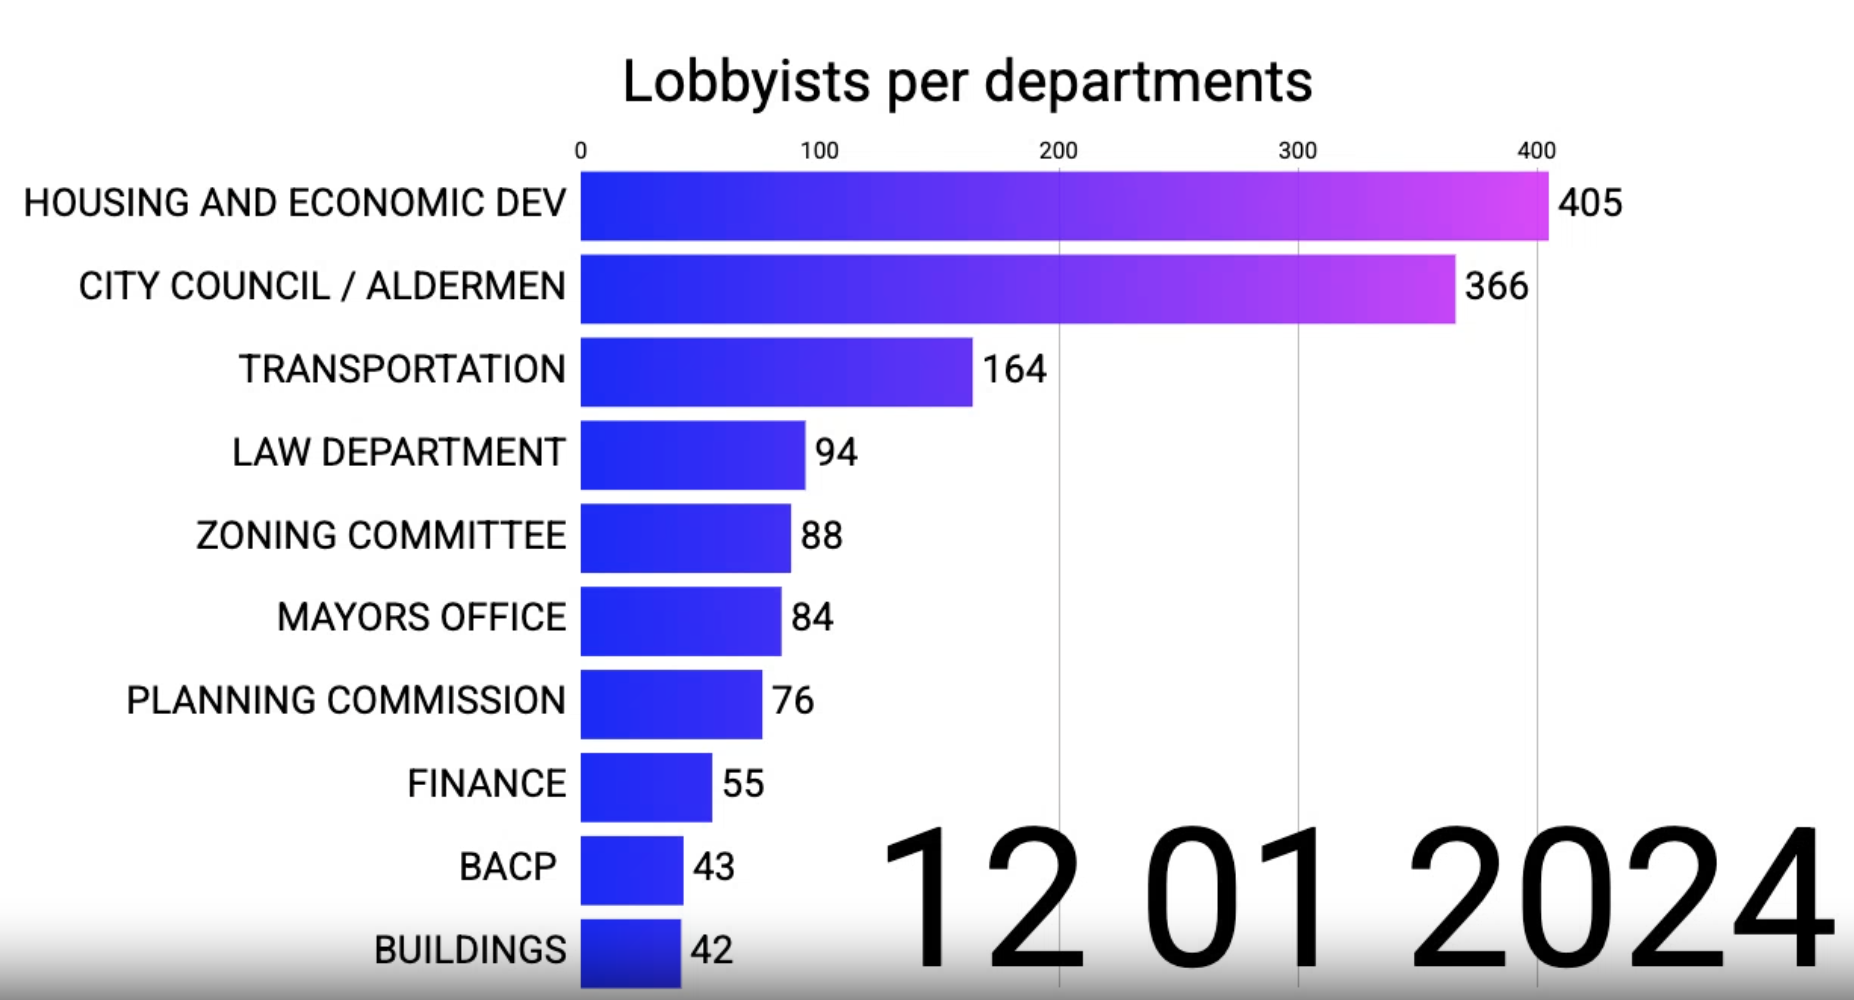
Lobbyist Data
This project uses pandas and streamlit to display the top lobbied departments, top lobbyist employers, and top states for lobbyists
See Visual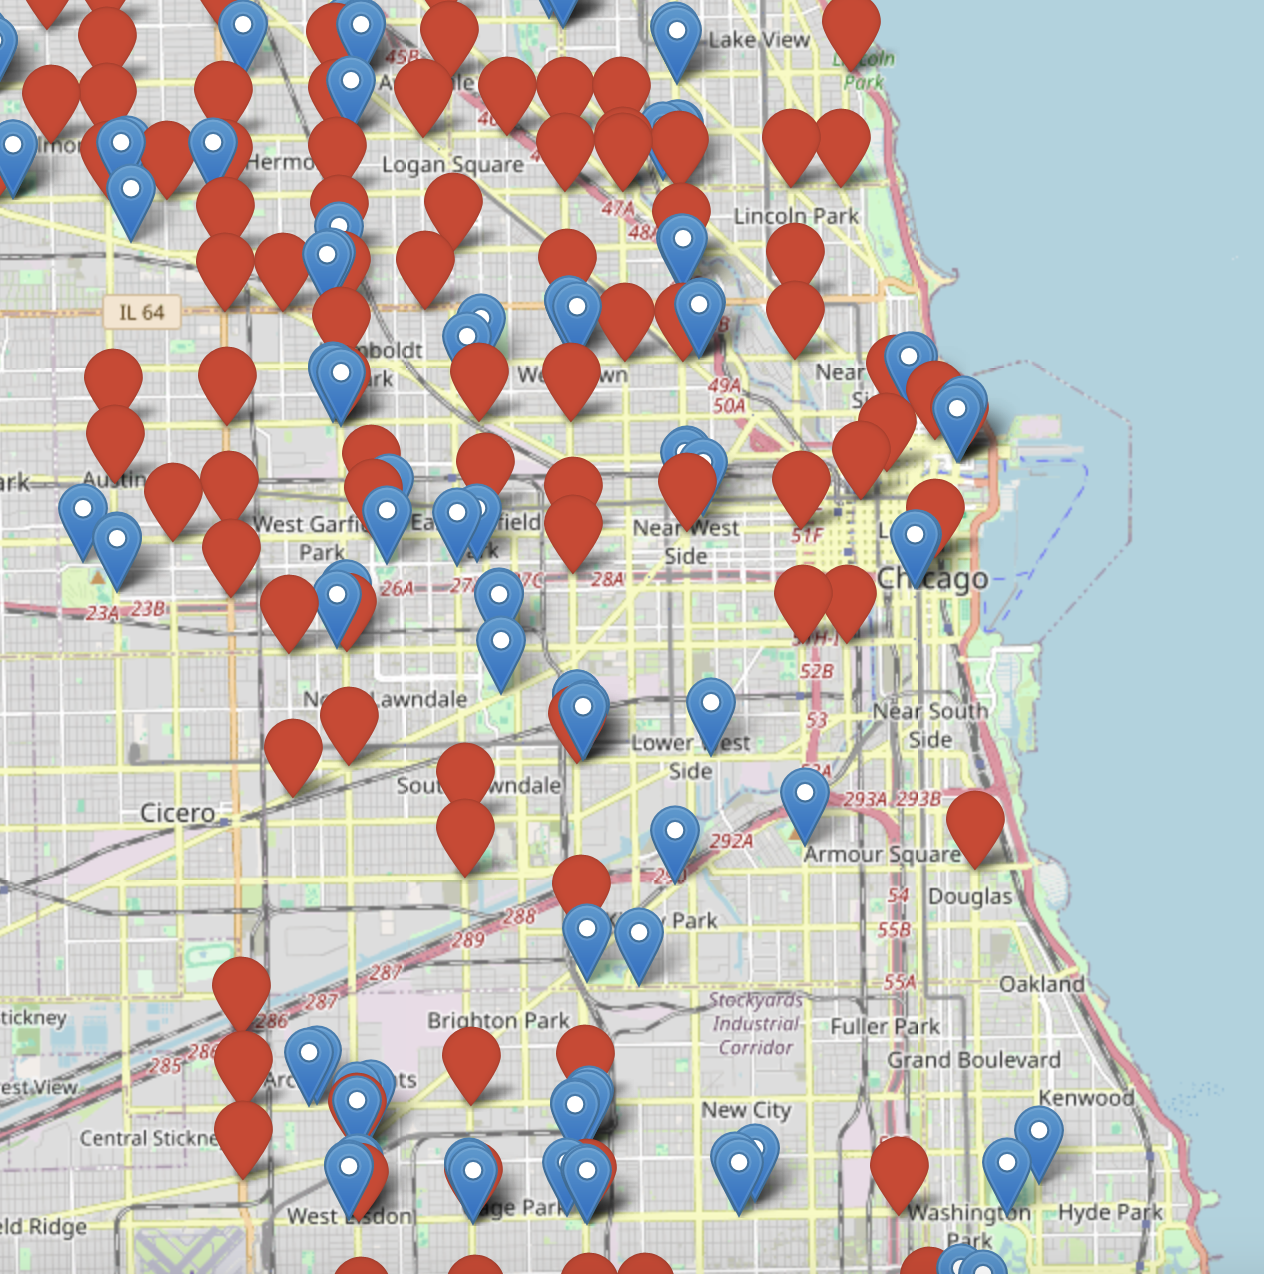
Red Light and Speed Cameras
This project uses a streamlit dashboard and folium mapping tools to provide a map of Red Light and Speed Cameras. It also provides the top 10 most activated red light and speed cameras around Chicago. Data courtesy of Kaggle.
See Visual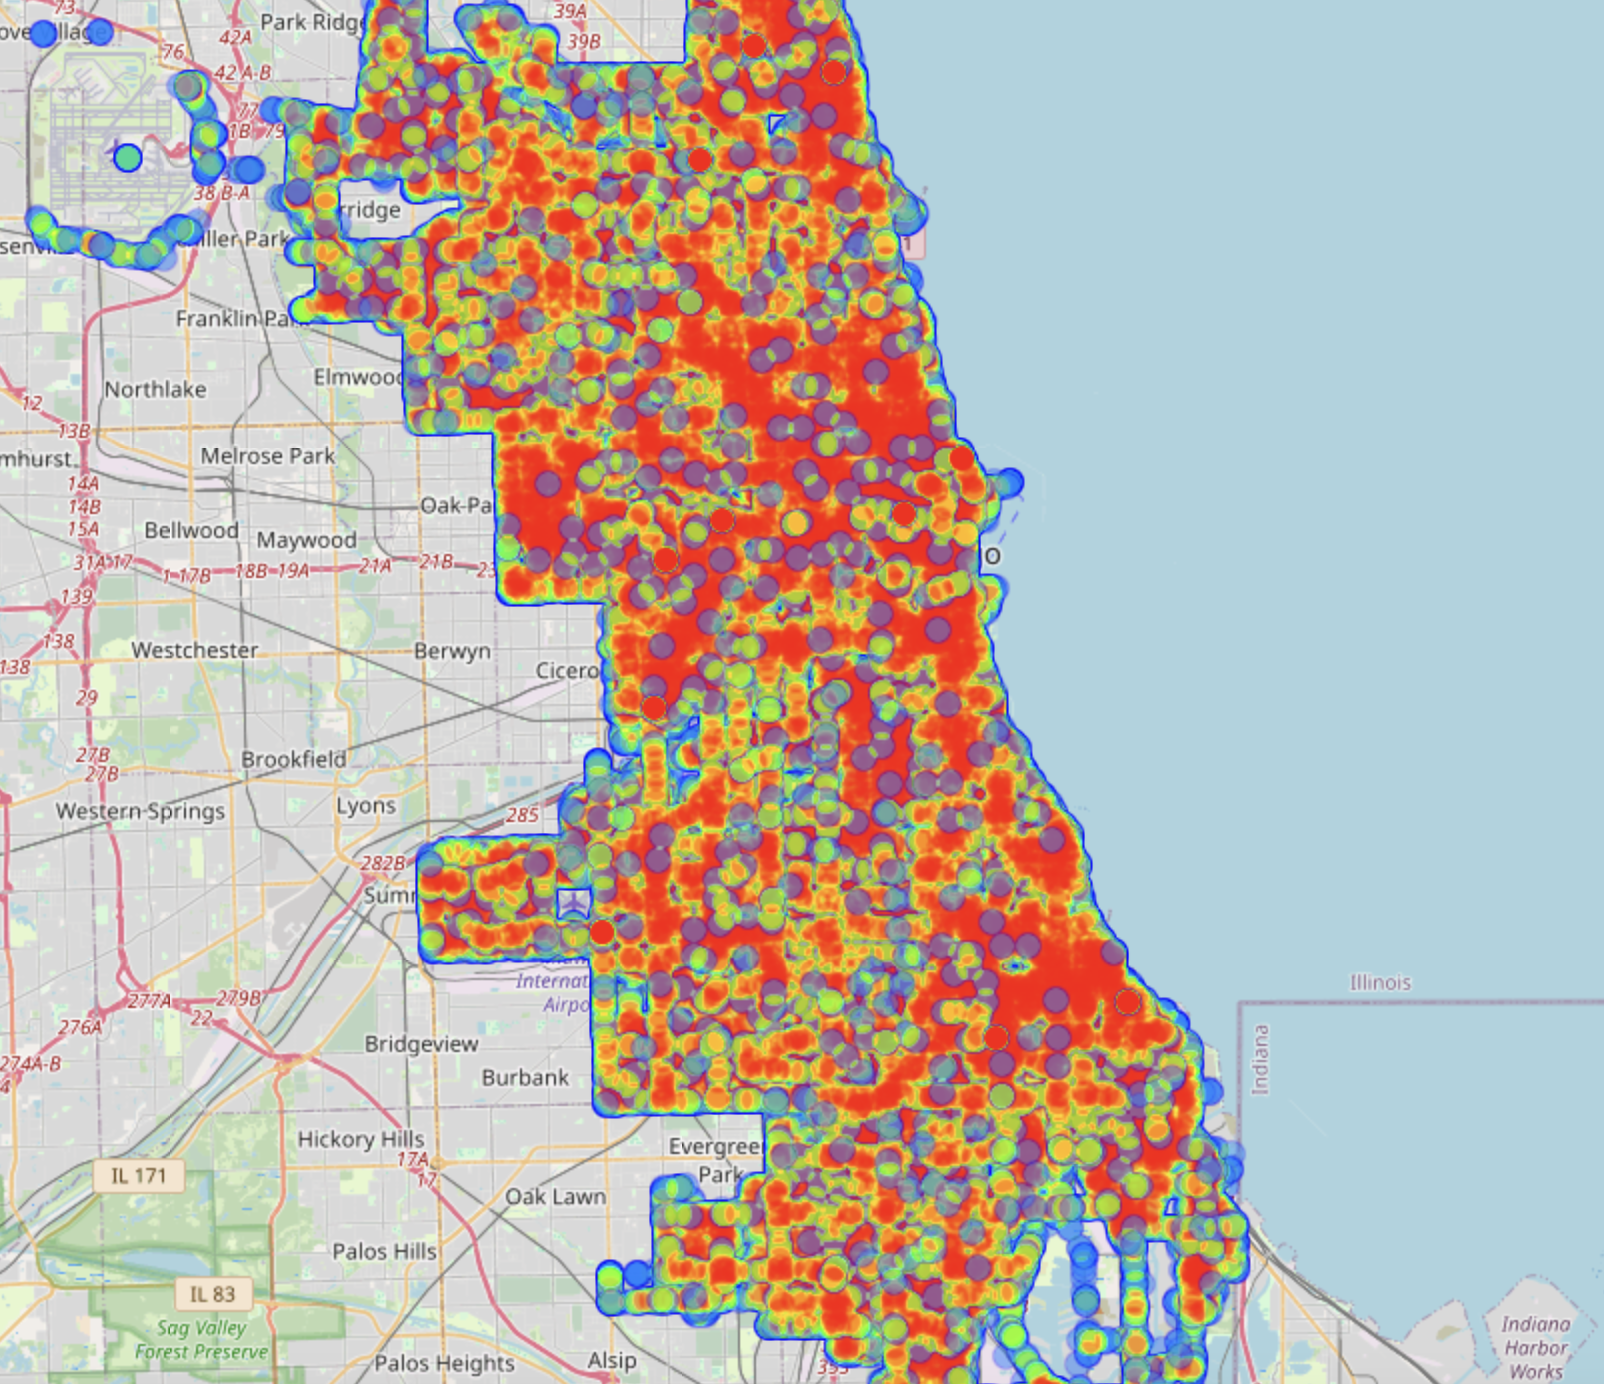
Traffic Crashes
This project uses a streamlit dashboard, folium mapping tools, and pandas data manipulation to provide a heatmap of traffic crashes in chicago sorted by year. Data from Kaggle csv and added to by API calls to the US Census Geocoding API.
See Visual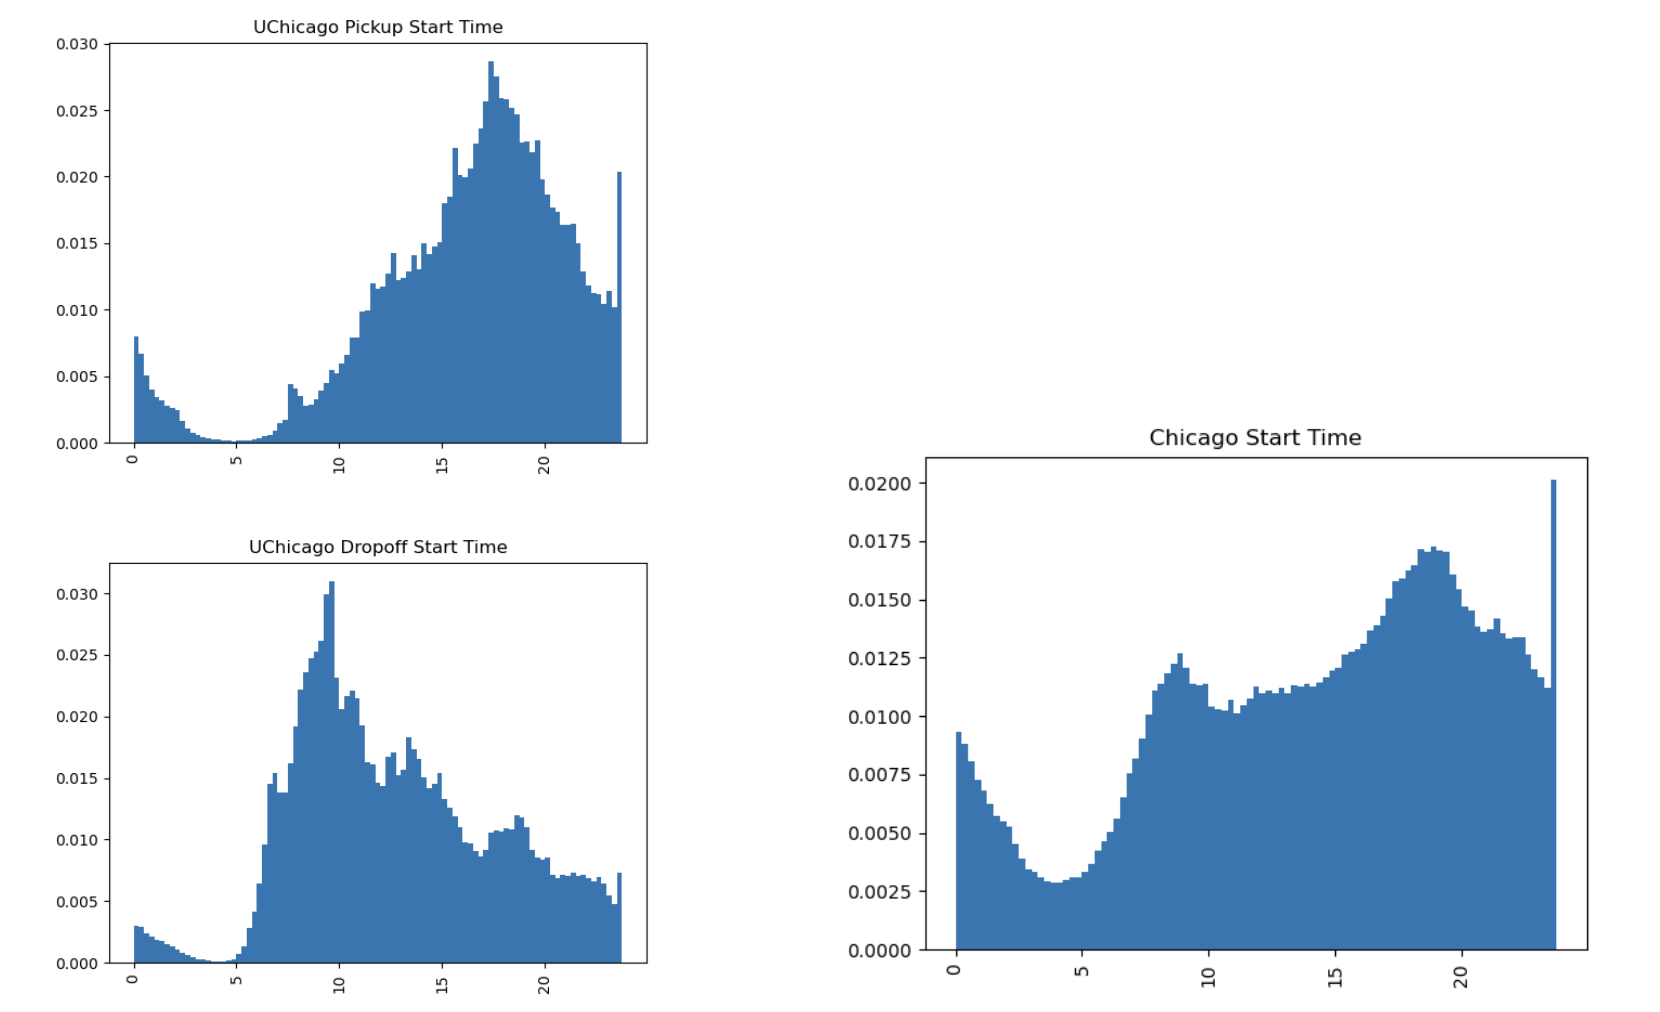
University of Chicago Lyft Data
This project uses public Lyft Data that we have filtered down to only include lyfts in the UChicago area.
See Visual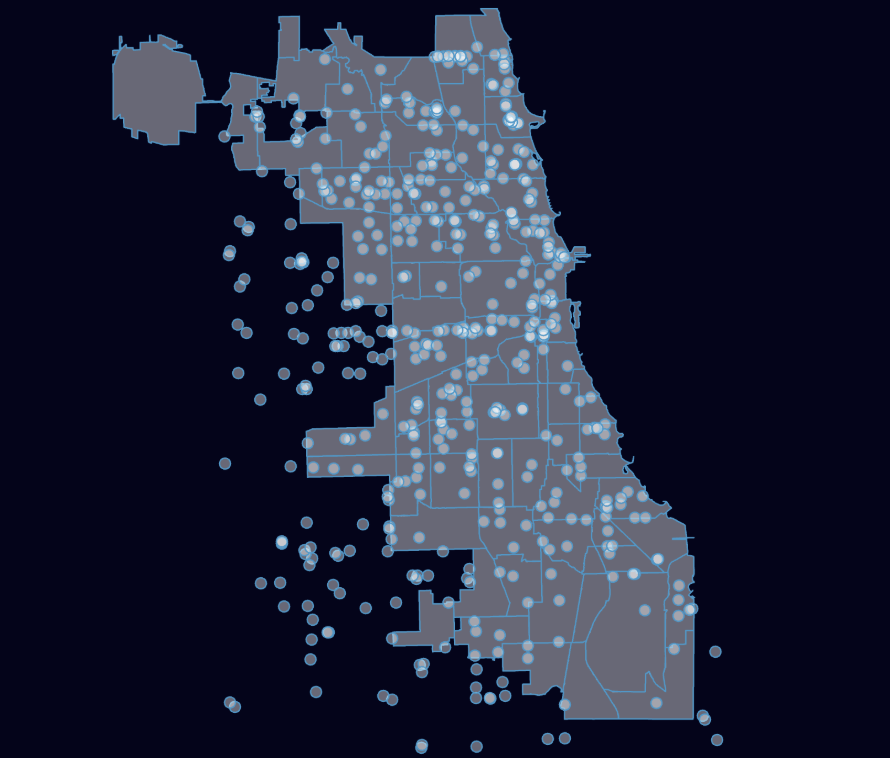
Chicago Grocery Stores
This project used the dataset from the Chicago Data Portal on grocery stores and updated it with data from the Google Maps API to show the availibility of food in different Chicago neighborhoods. It is overlayed with preterm birth rate data from the Chicago Data Portal. The main tool in this project is openlayers
See Visual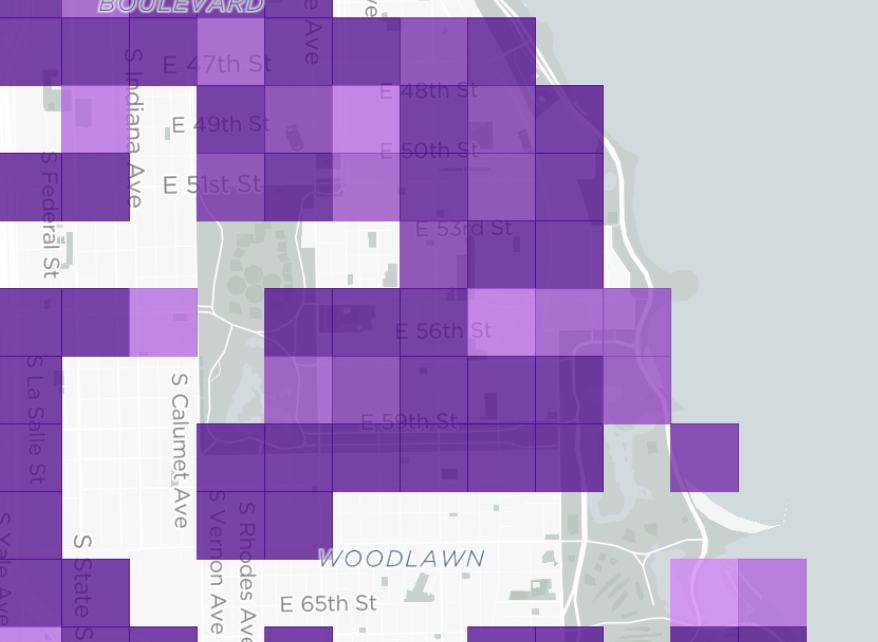
Internet Usage and Availability
This project displays internet usage and availibility by block in Chicago.
See Visual